
Availability & resolution times
Calculations distinguish sensor readings from operational reports. Period selection, cancellations and closure rules make the metrics interpretable for the people using them.
 Enlarge screenshot

RATP Toilettes Connectées
One workspace to understand the equipment fleet, replay field events and track incidents through to resolution. Sensor data and operational reports come together in an interface built around the work of the team.
All case studies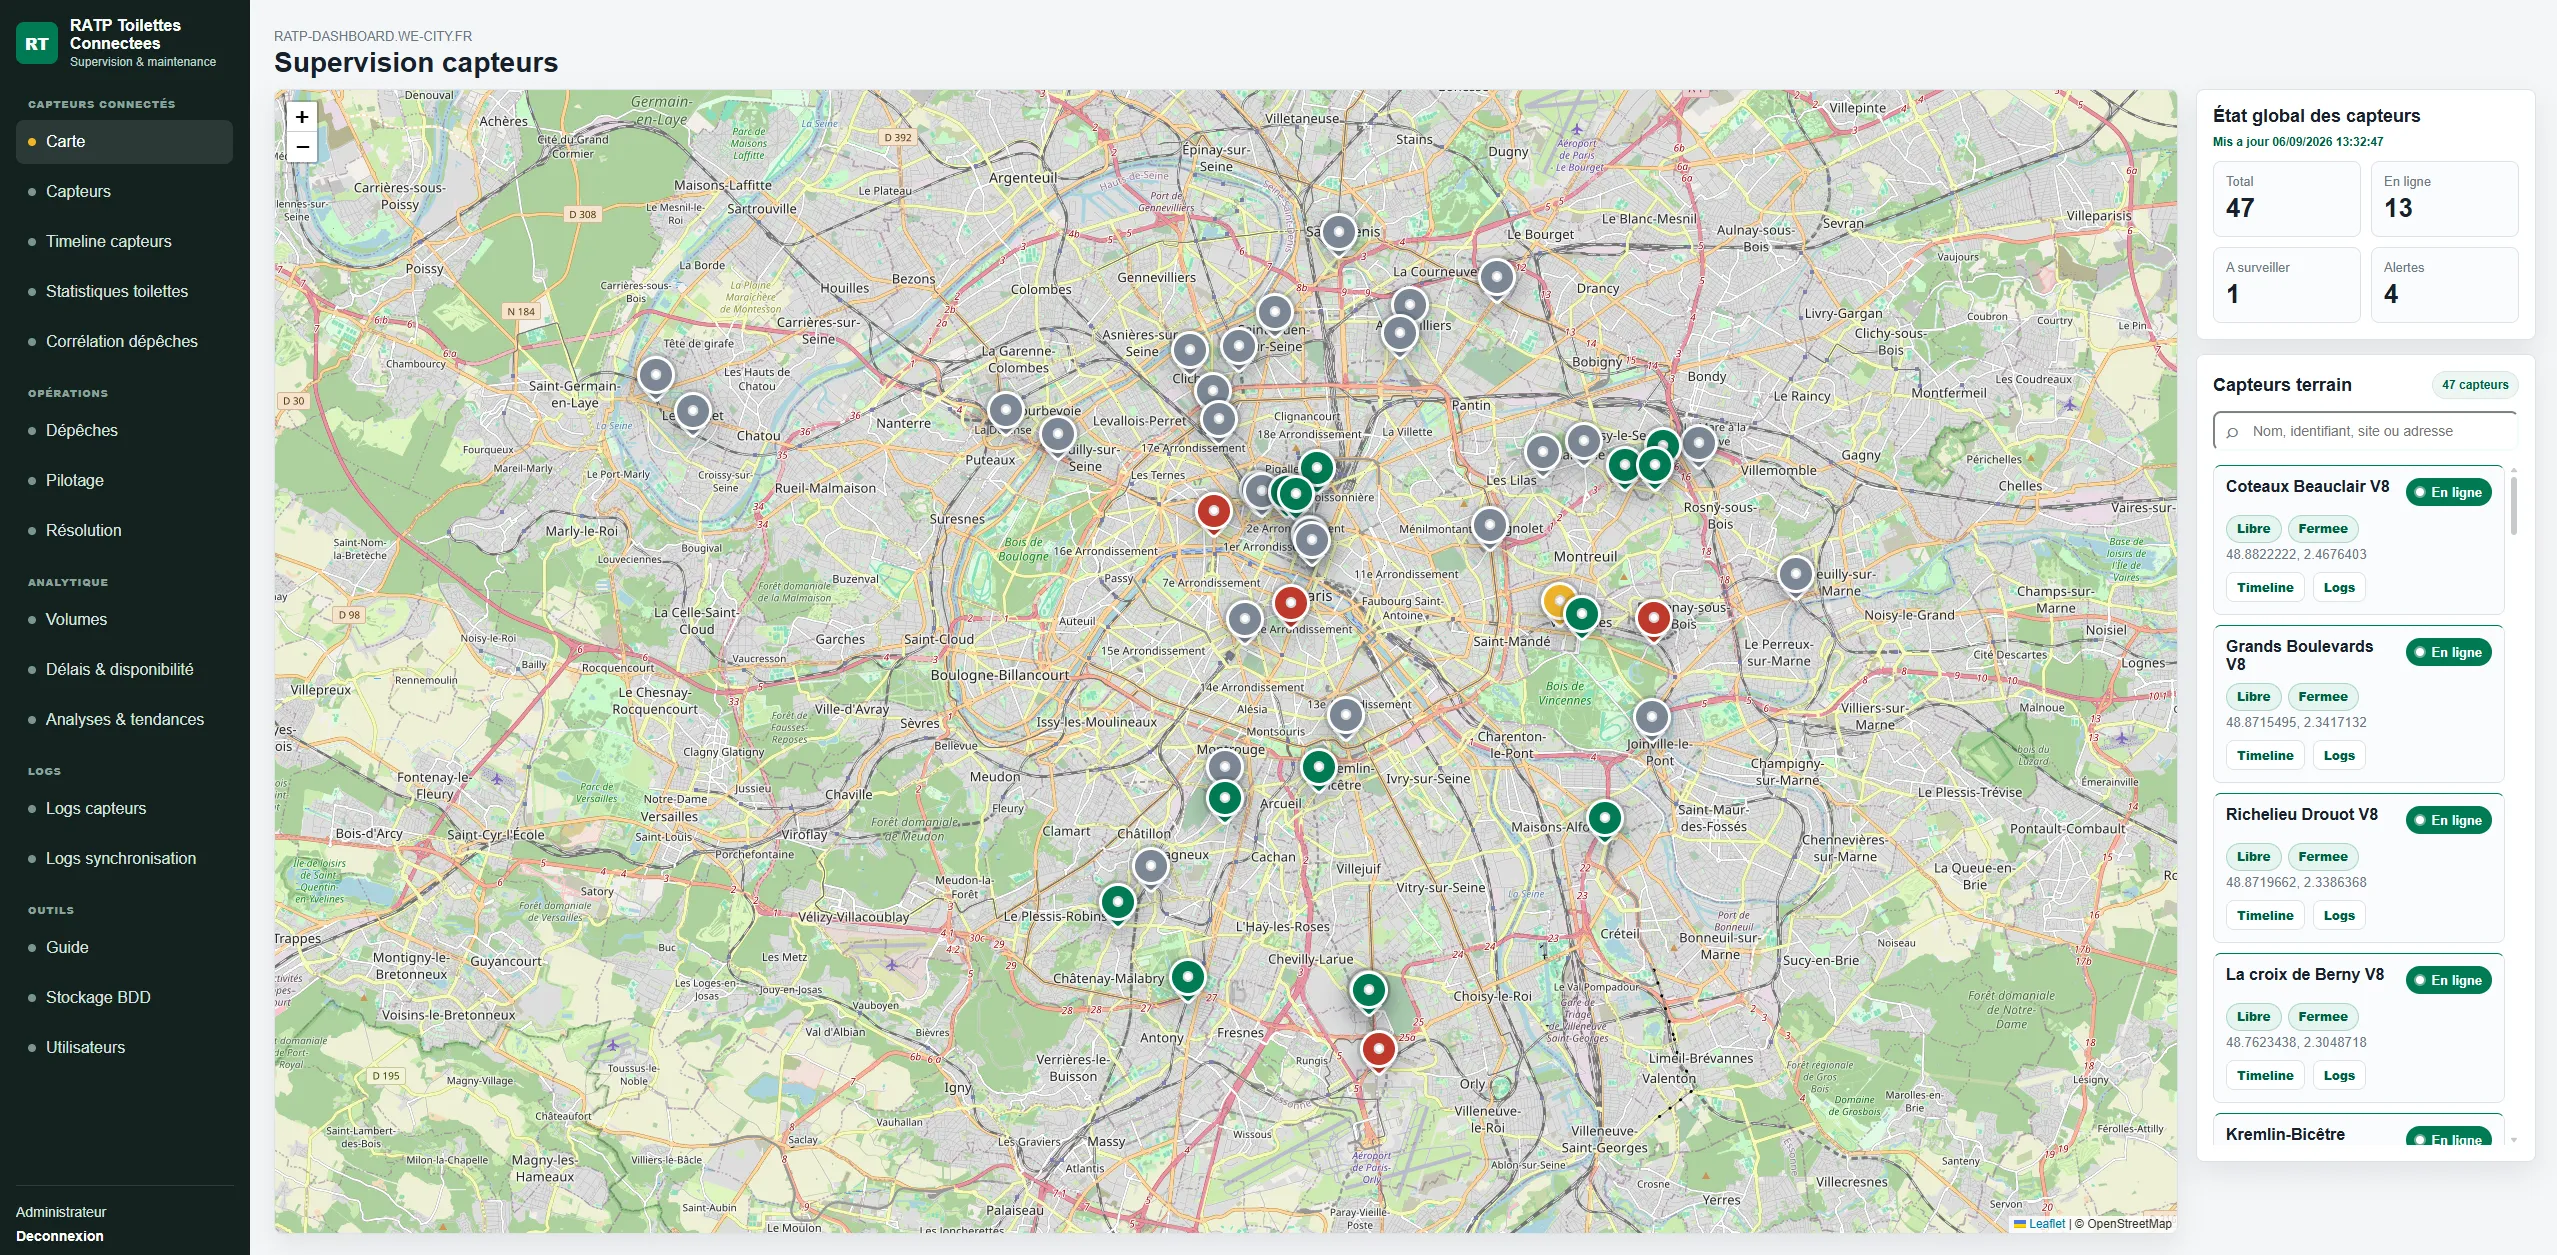 Enlarge screenshot
01 / The need
Connected equipment reports availability, door status, operating mode, faults and its latest signal. Meanwhile, operations teams work with incident reports, acknowledgements and maintenance workflows.
The challenge is to connect these perspectives: understand a situation, find what happened before it and decide what to do next. An alert becomes the starting point for investigation and a tracked action.
Equipment readings and operational events retain their source. Bringing them together provides context for investigation and action.
An authorised command enters a queue, is sent to the controller and remains tracked until execution is acknowledged. Service changes, shutdowns, maintenance and technical actions have their own states and history.
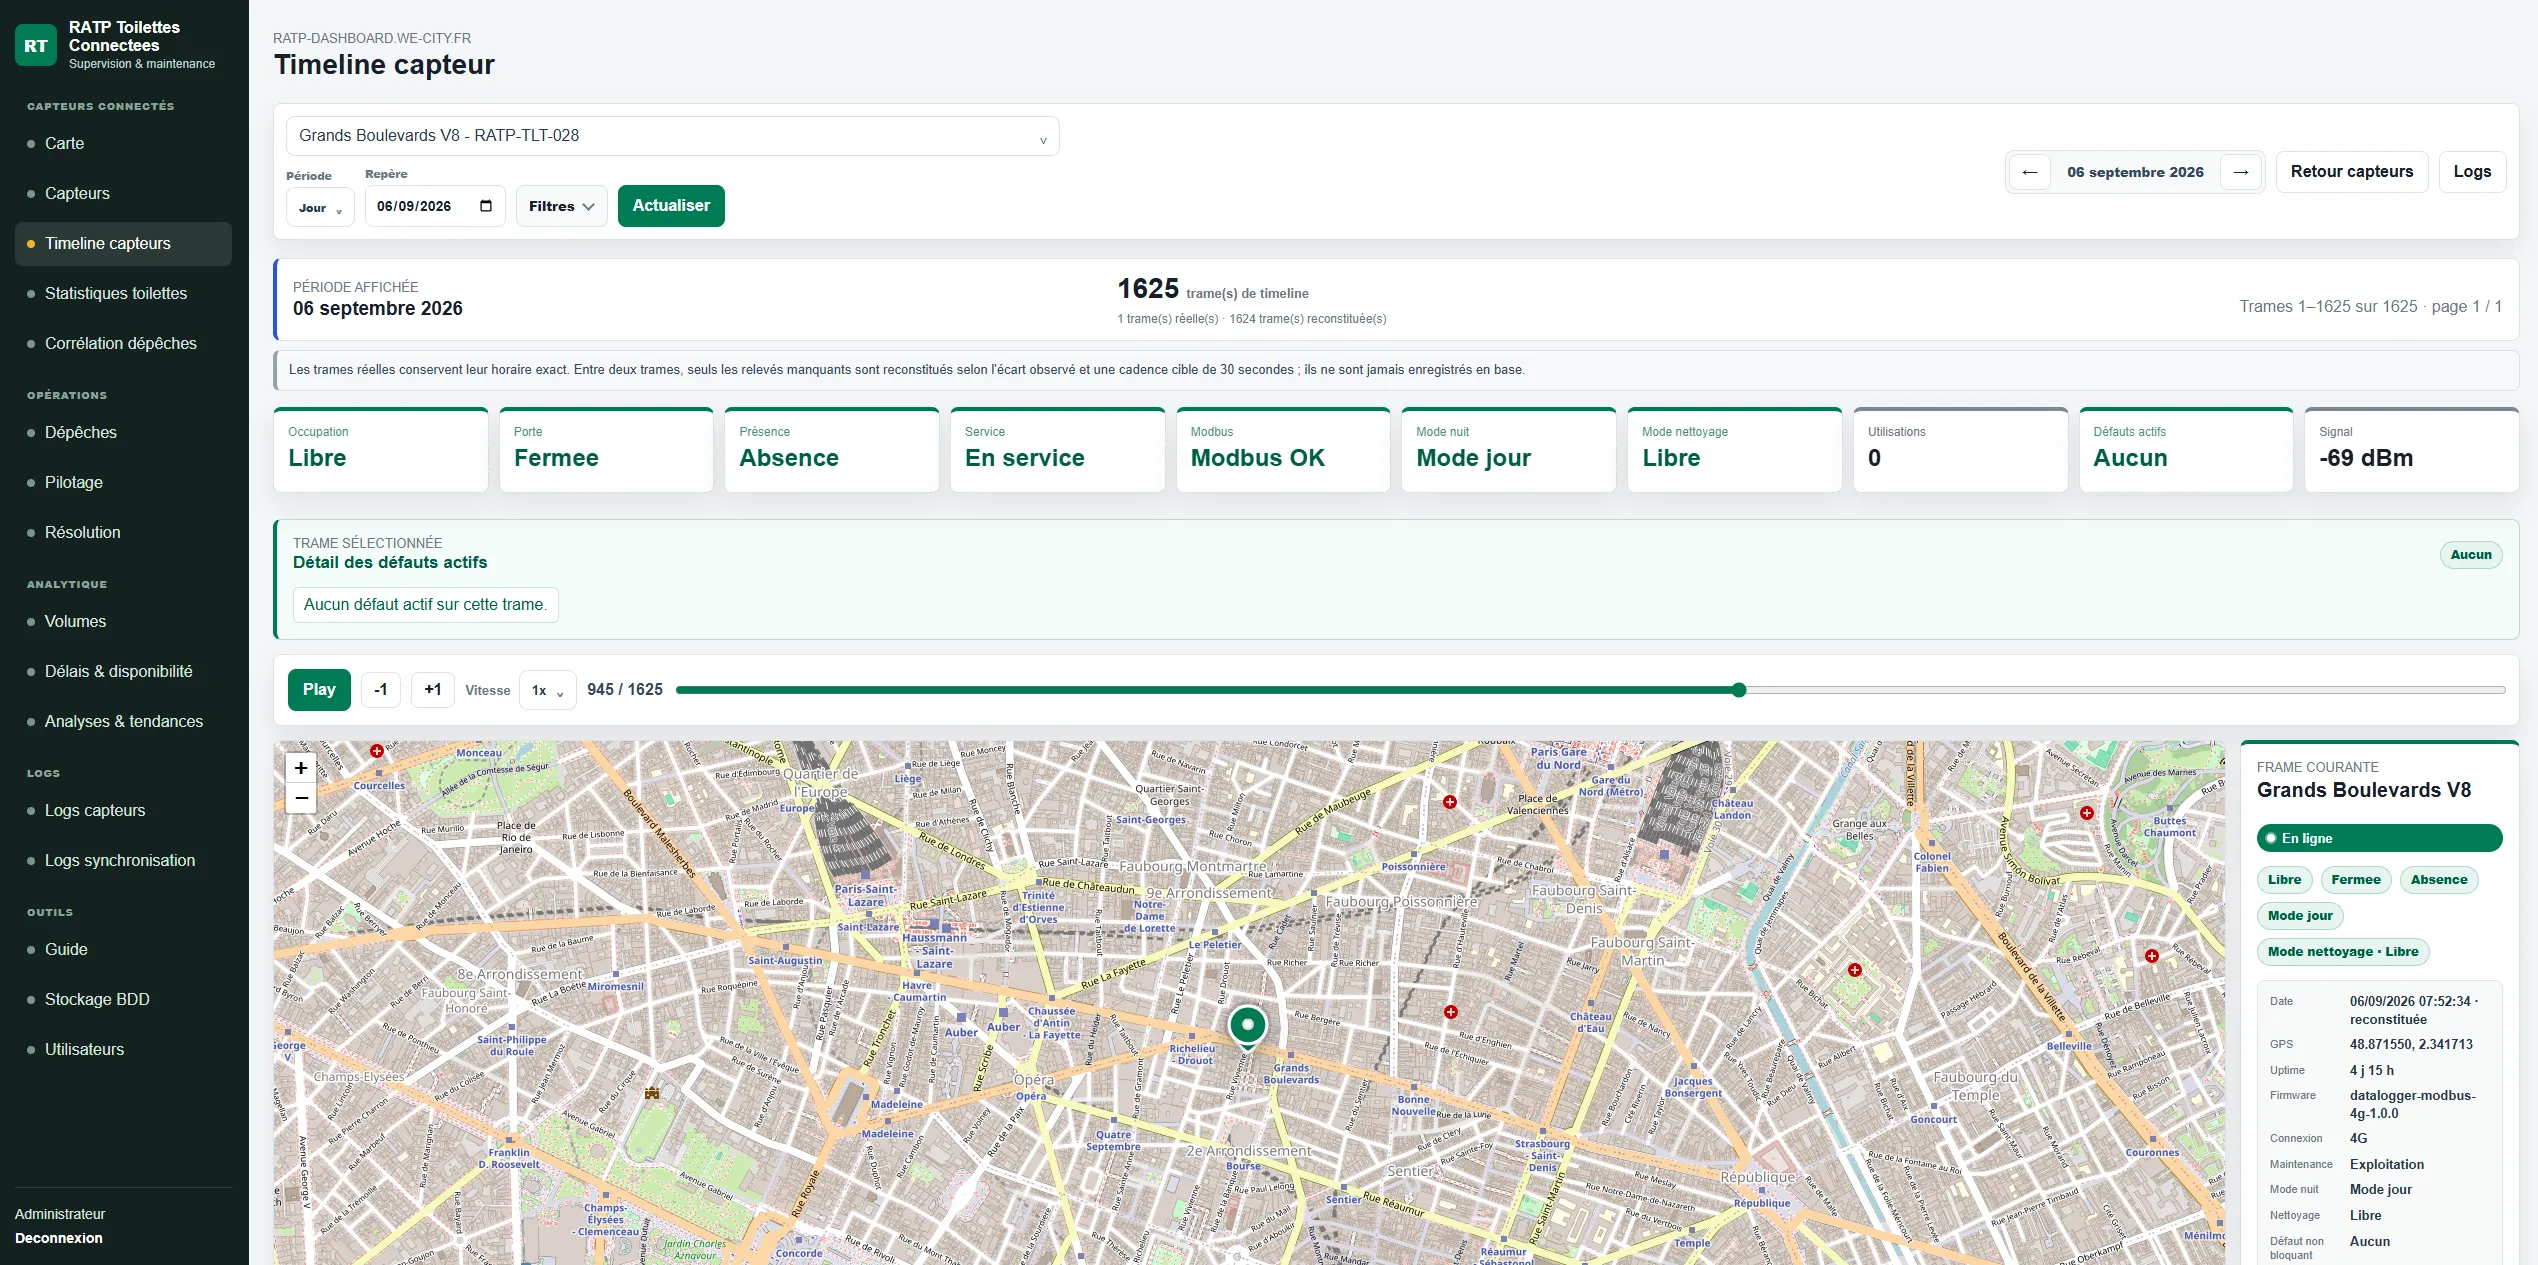
A timeline lets the user return to a specific moment and read occupancy, door status, service, faults and signal together. The player fills the intervals between events while distinguishing received readings from reconstructed states.
Reconstructed states support the timeline view; they are never stored as actual device readings.
 Enlarge screenshot
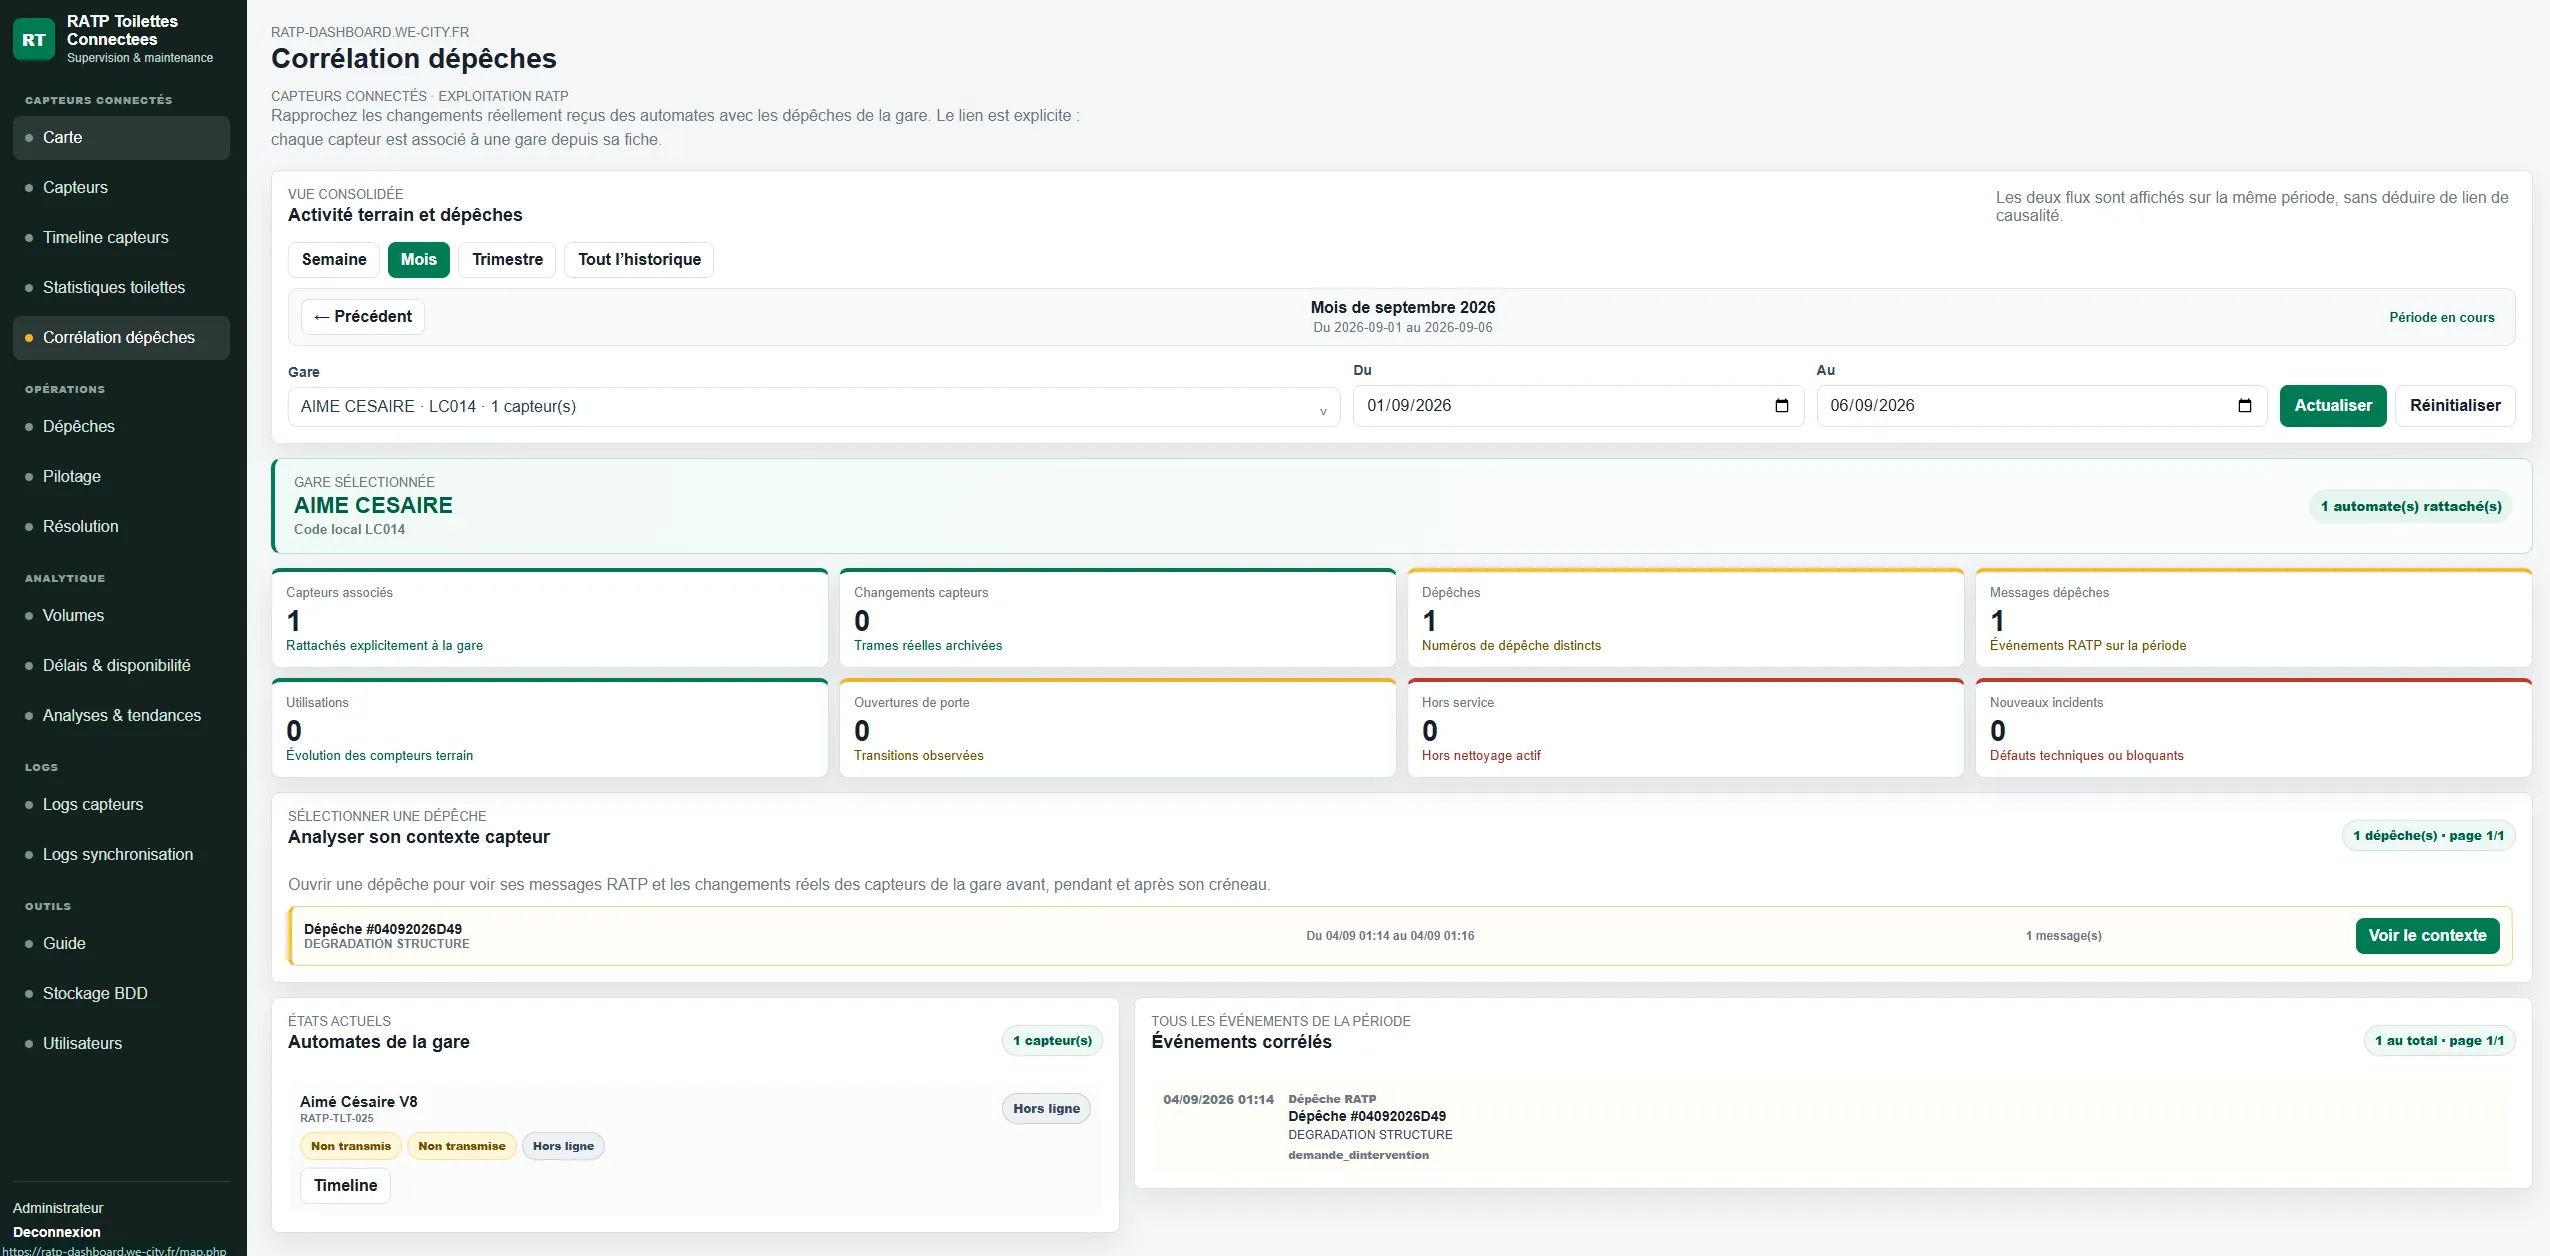
Events are brought together by device and station over a selected period. The user can inspect sensor changes and operational messages before, during and after a report to understand its context.
The view aligns the two streams in time without automatically inferring causation.
 Enlarge screenshot
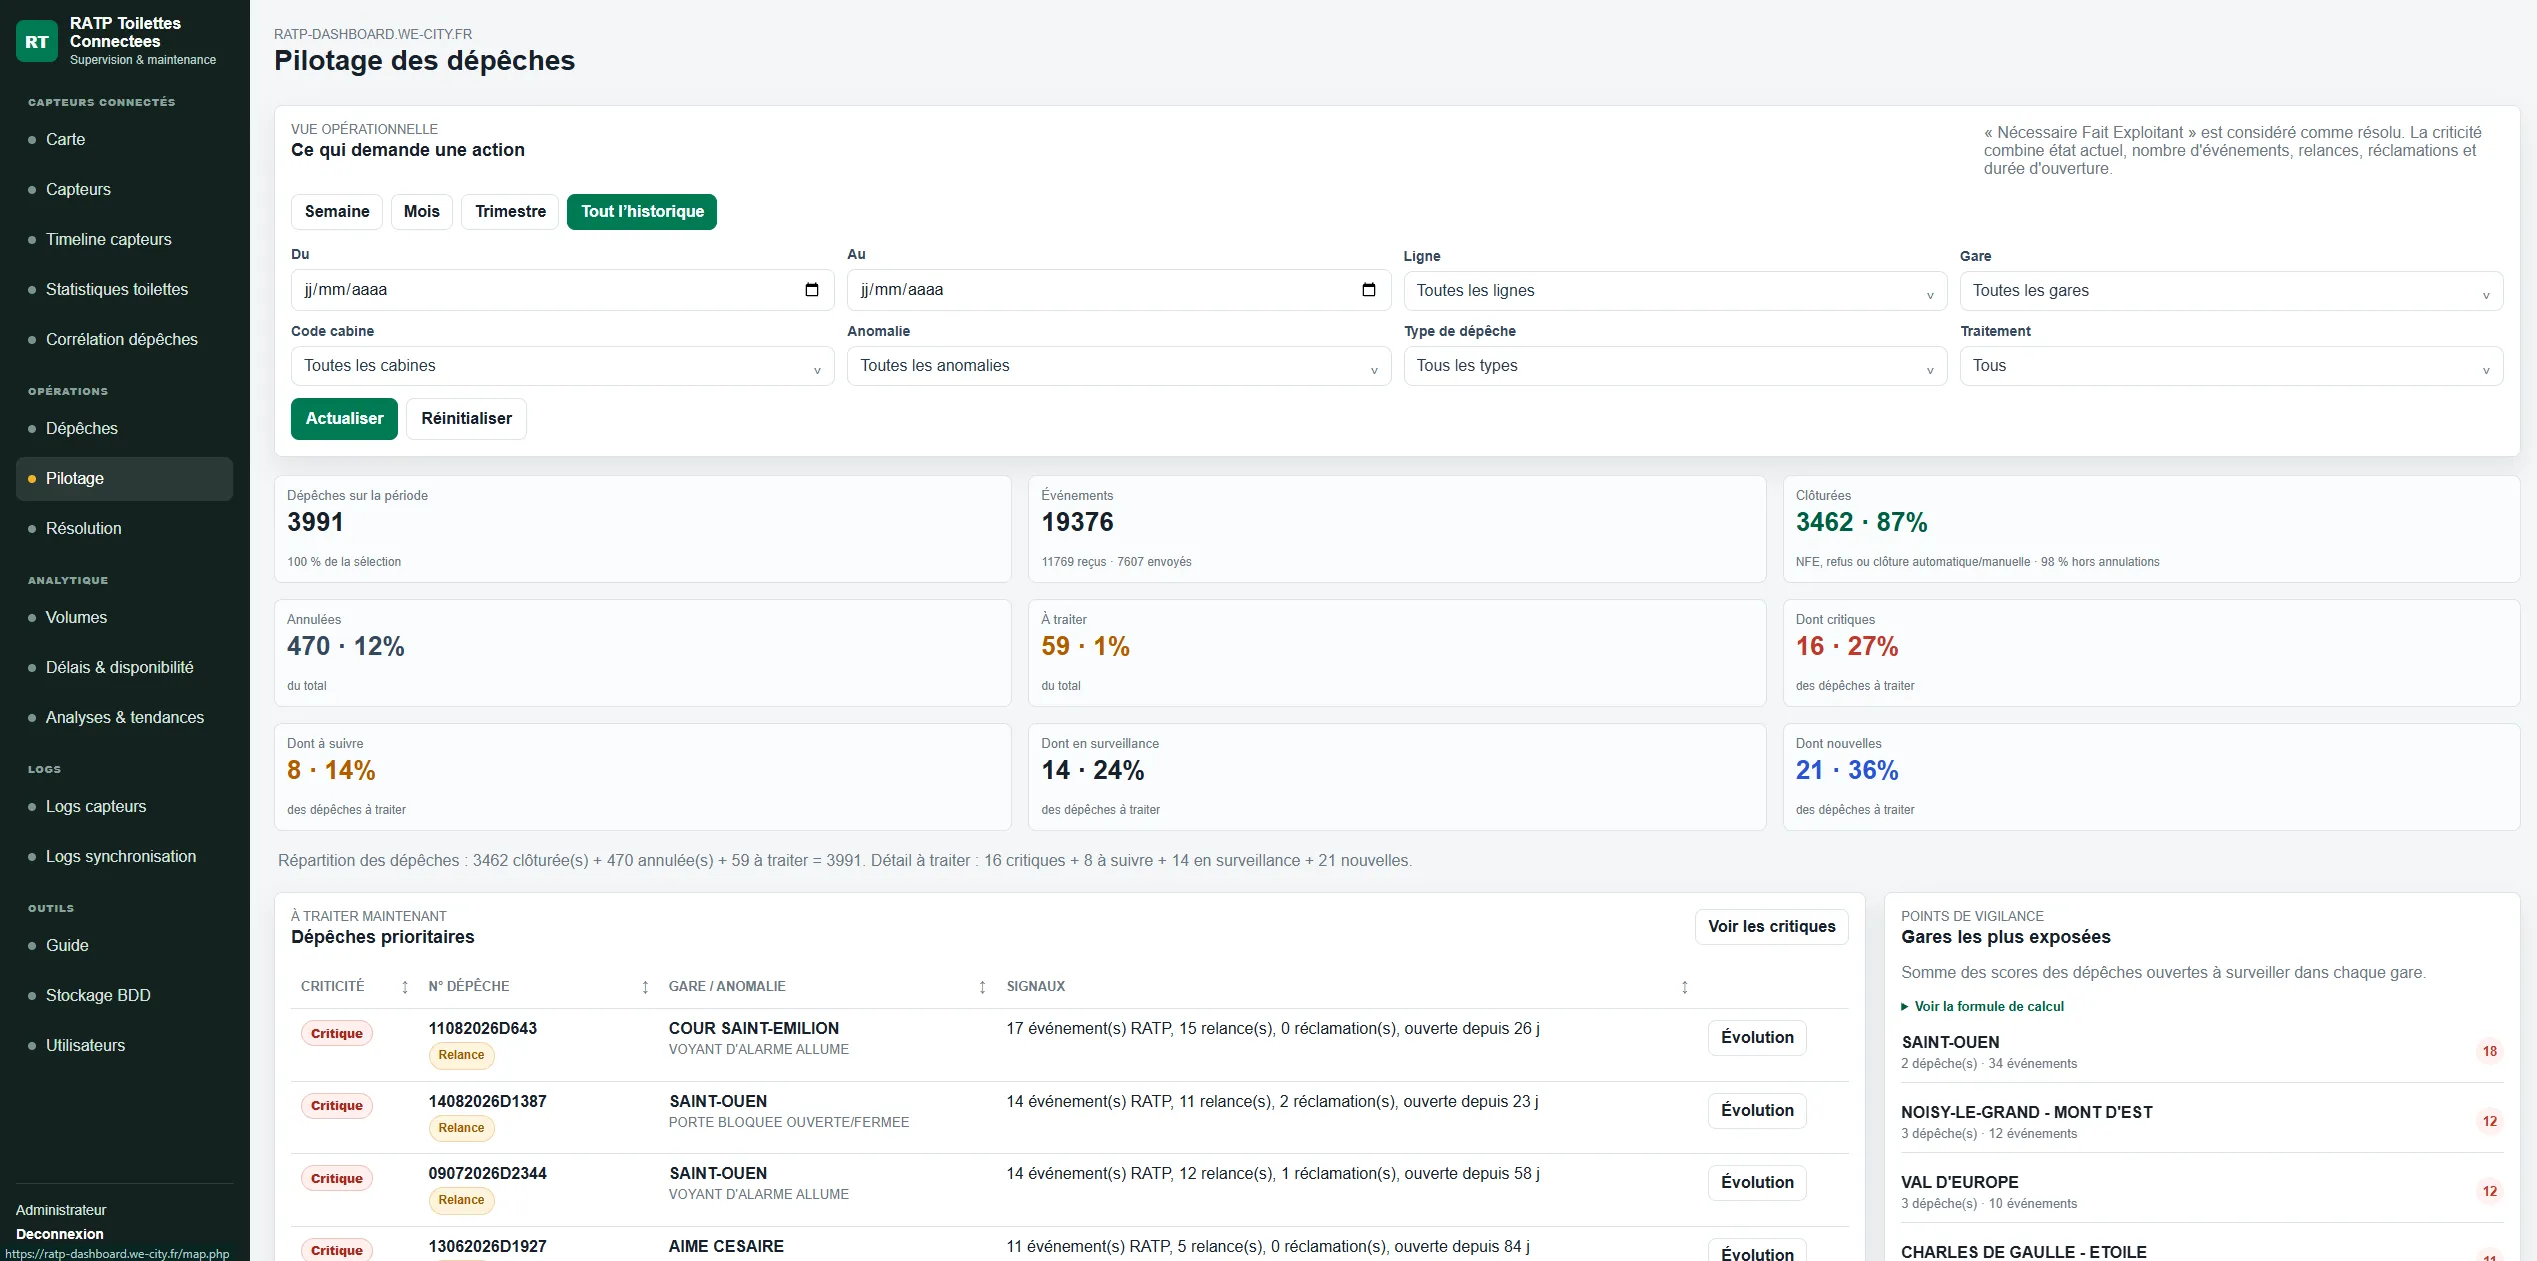
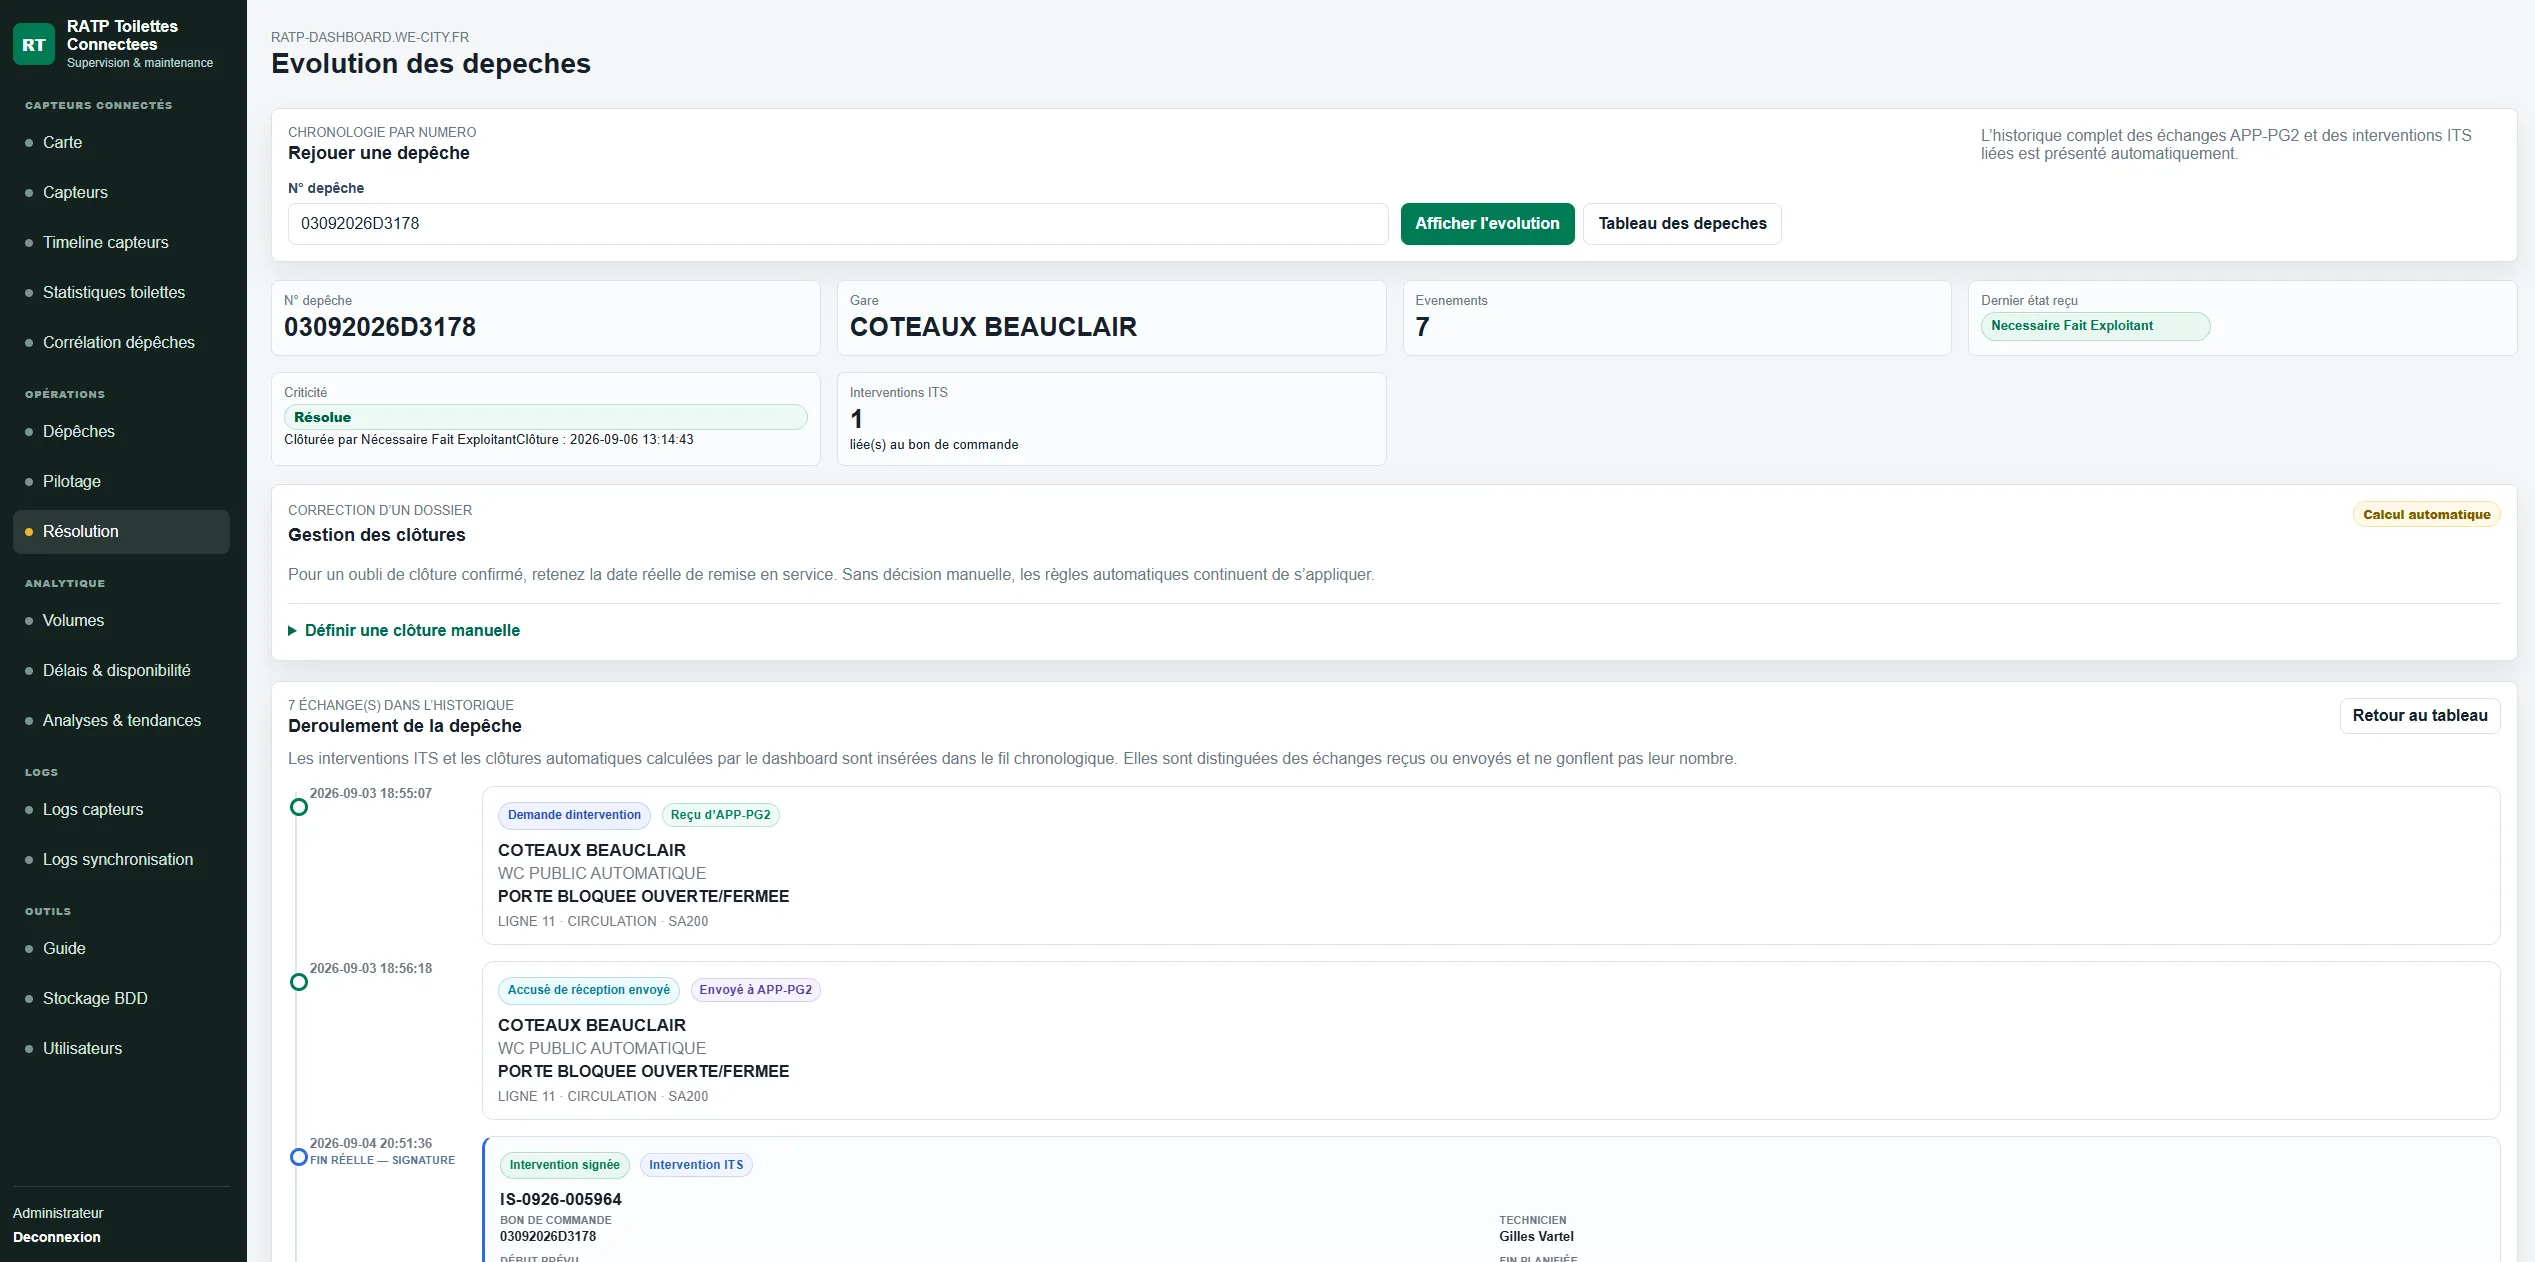
The operations view brings outstanding reports, follow-ups and critical situations together. Each incident lifecycle retains acknowledgements, refusals, cancellations and automatic or manual closure.
The team can move from the overall situation to a report, inspect its history and follow its resolution.
 Enlarge screenshot
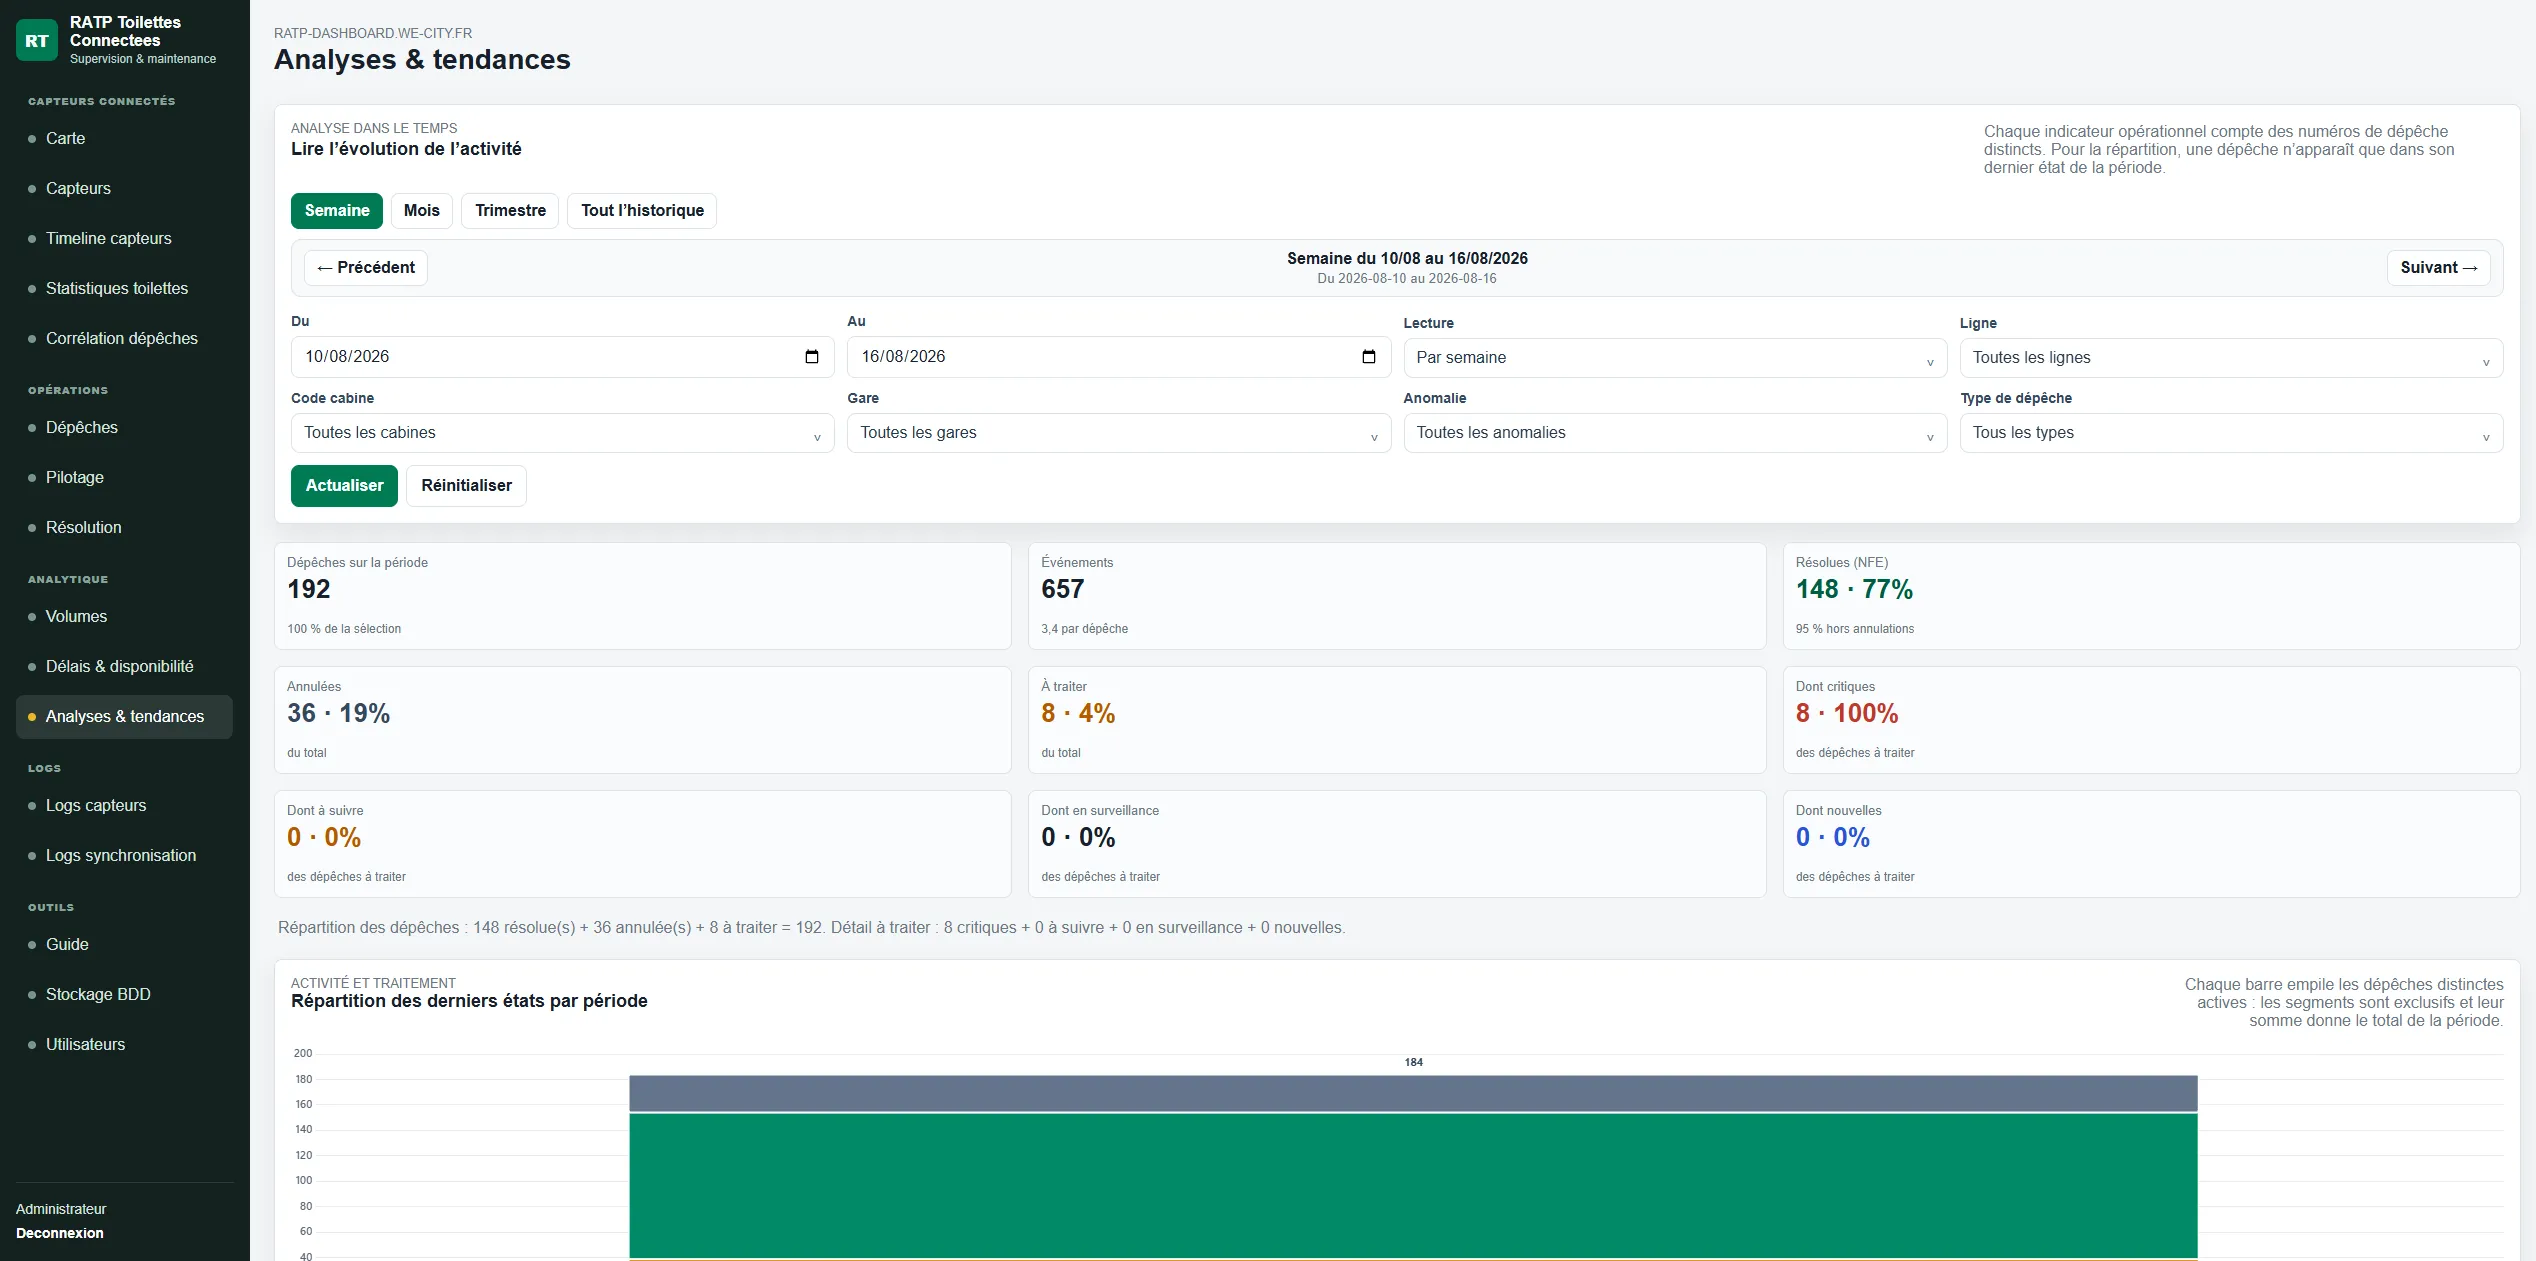
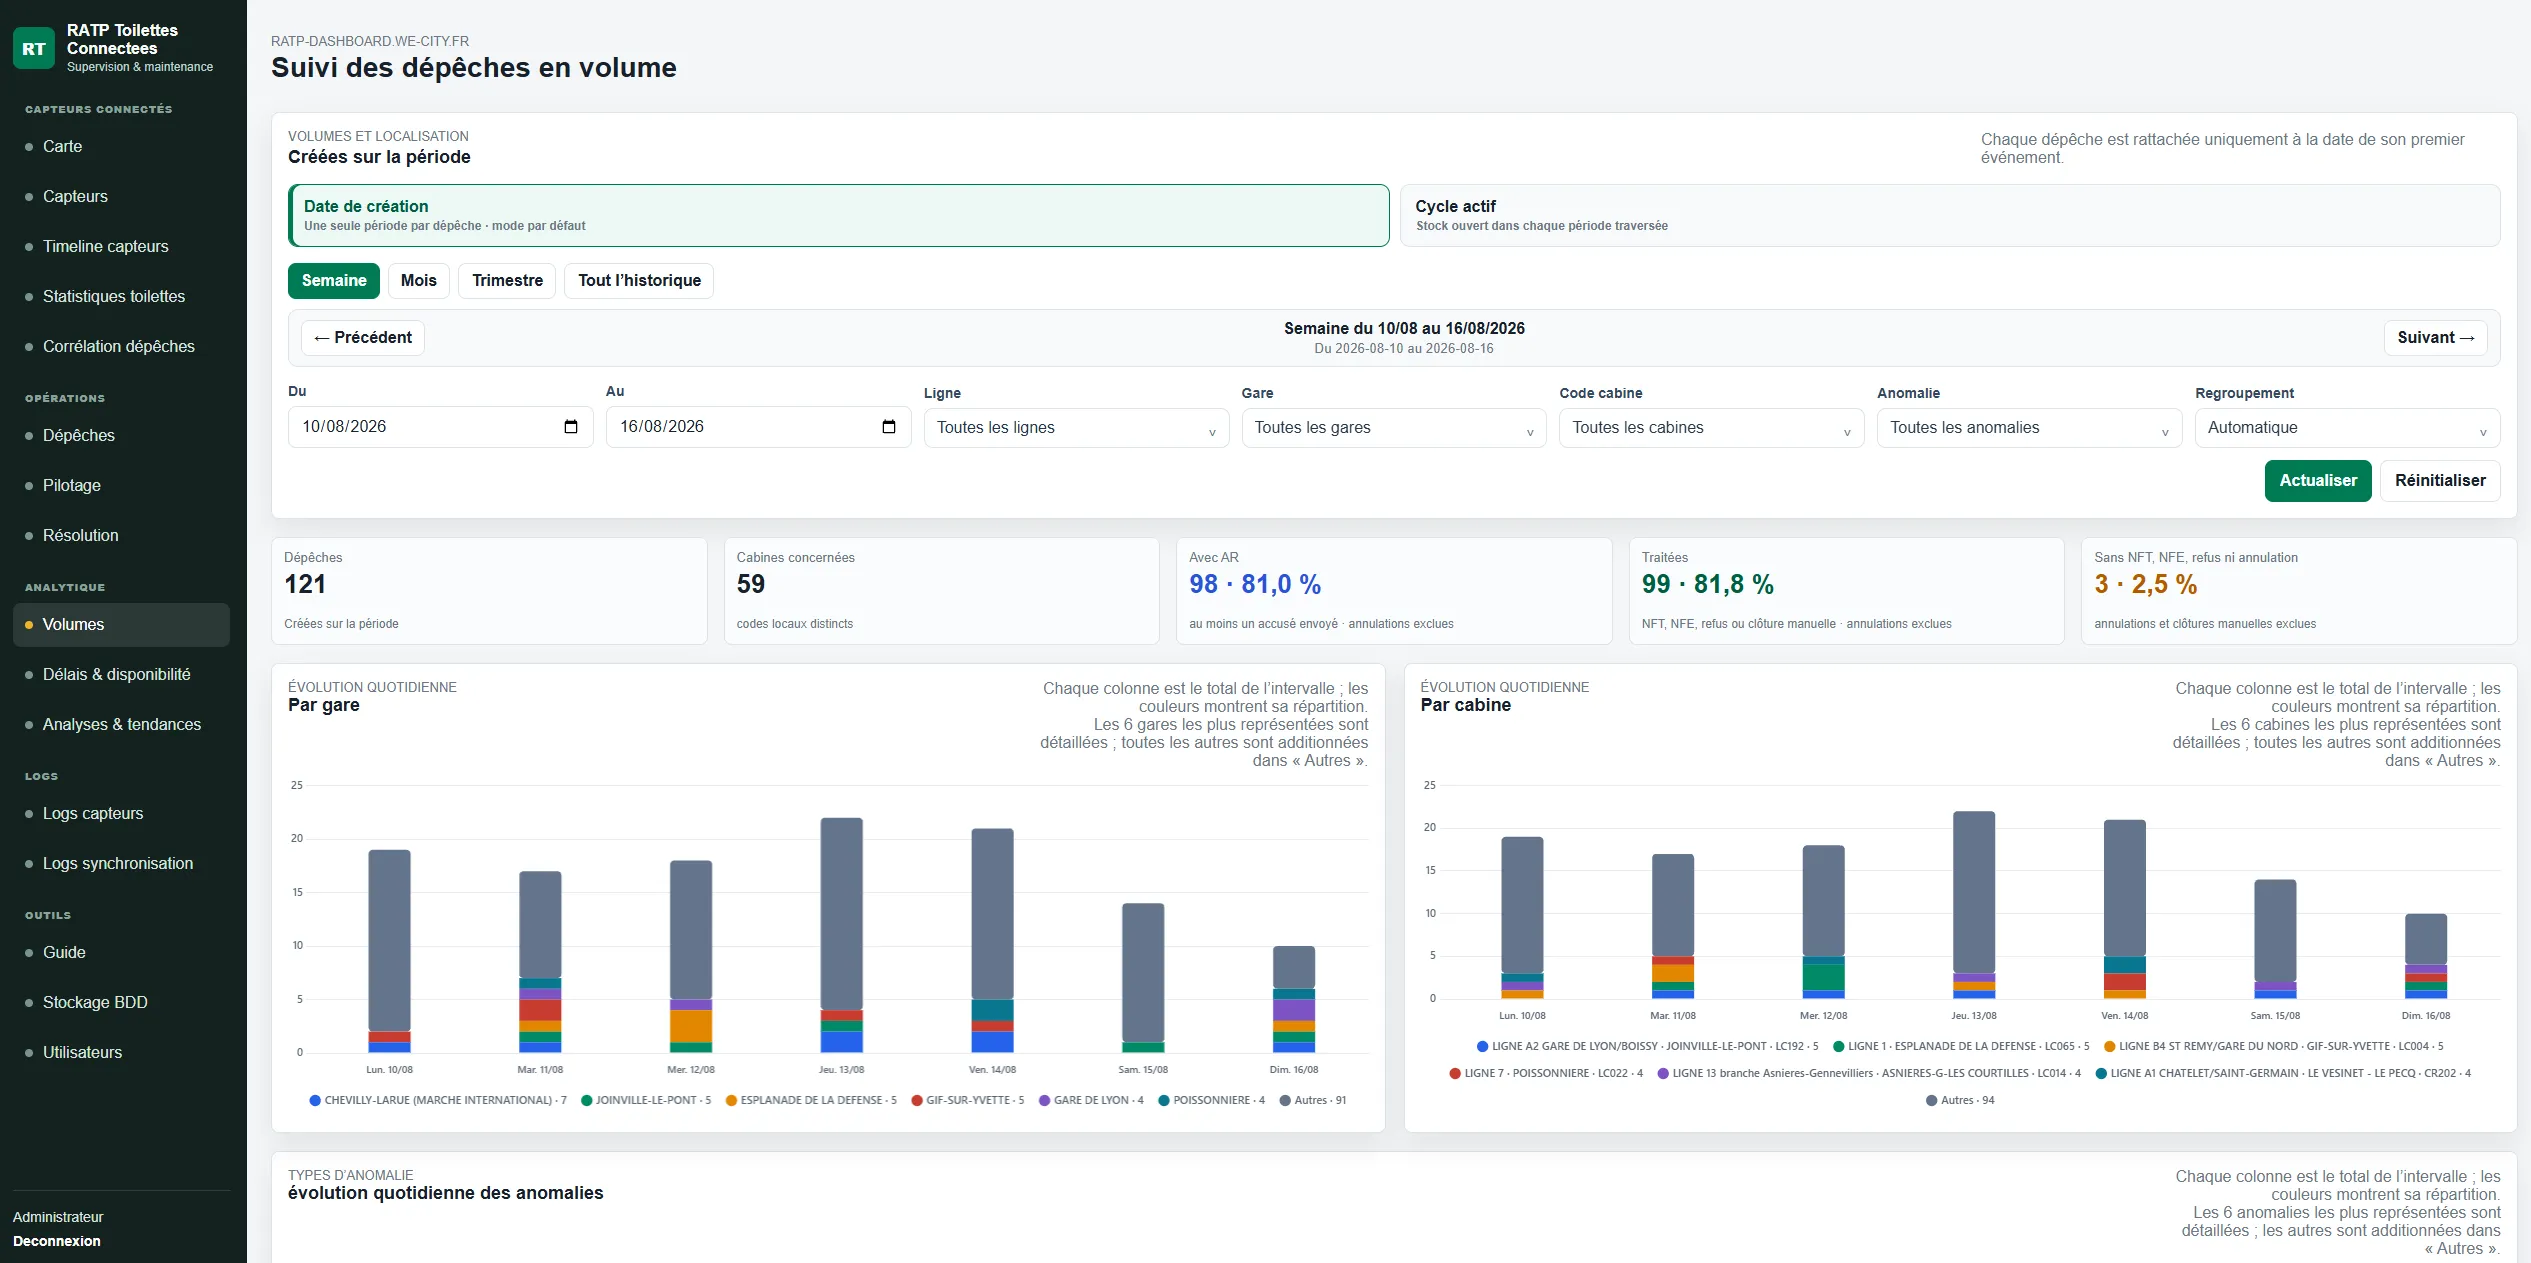
Live monitoring connects with availability, response-time and trend analysis. Filters make it possible to inspect the scope and time period behind a result.
Calculations distinguish sensor readings from operational reports. Period selection, cancellations and closure rules make the metrics interpretable for the people using them.
Enlarge screenshotWeekly, monthly and quarterly views show how volumes and final report states evolve. Teams can explore the lines, stations or devices that need attention.
 Enlarge screenshot
Clear screens depend on structured data flows, consistent state handling and traceability.
Device-specific API keys, payload normalisation and deduplication of state changes.
Offline detection and interval reconstruction without presenting reconstructed states as actual readings.
A command queue, intermediate states and execution acknowledgements for actions sent to controllers.
Synchronising several sources, parsing reports and handling cancellations, refusals and different closure paths.
Availability and response-time calculations adapted to the data source, time window and processing rules.
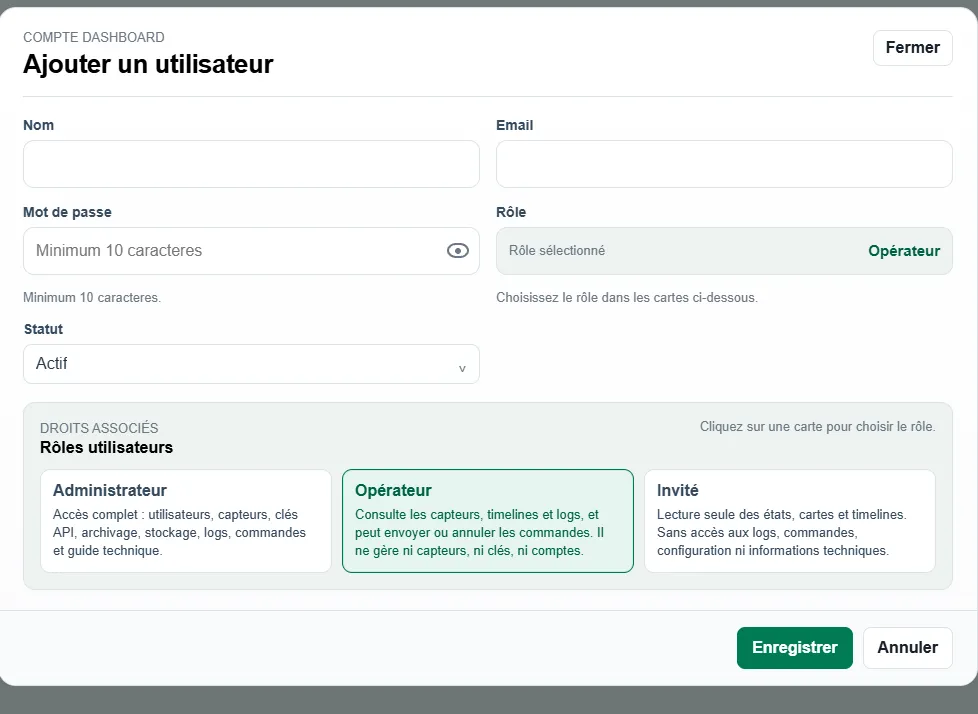
Administrator, operator and read-only permissions for data, configuration and device commands.
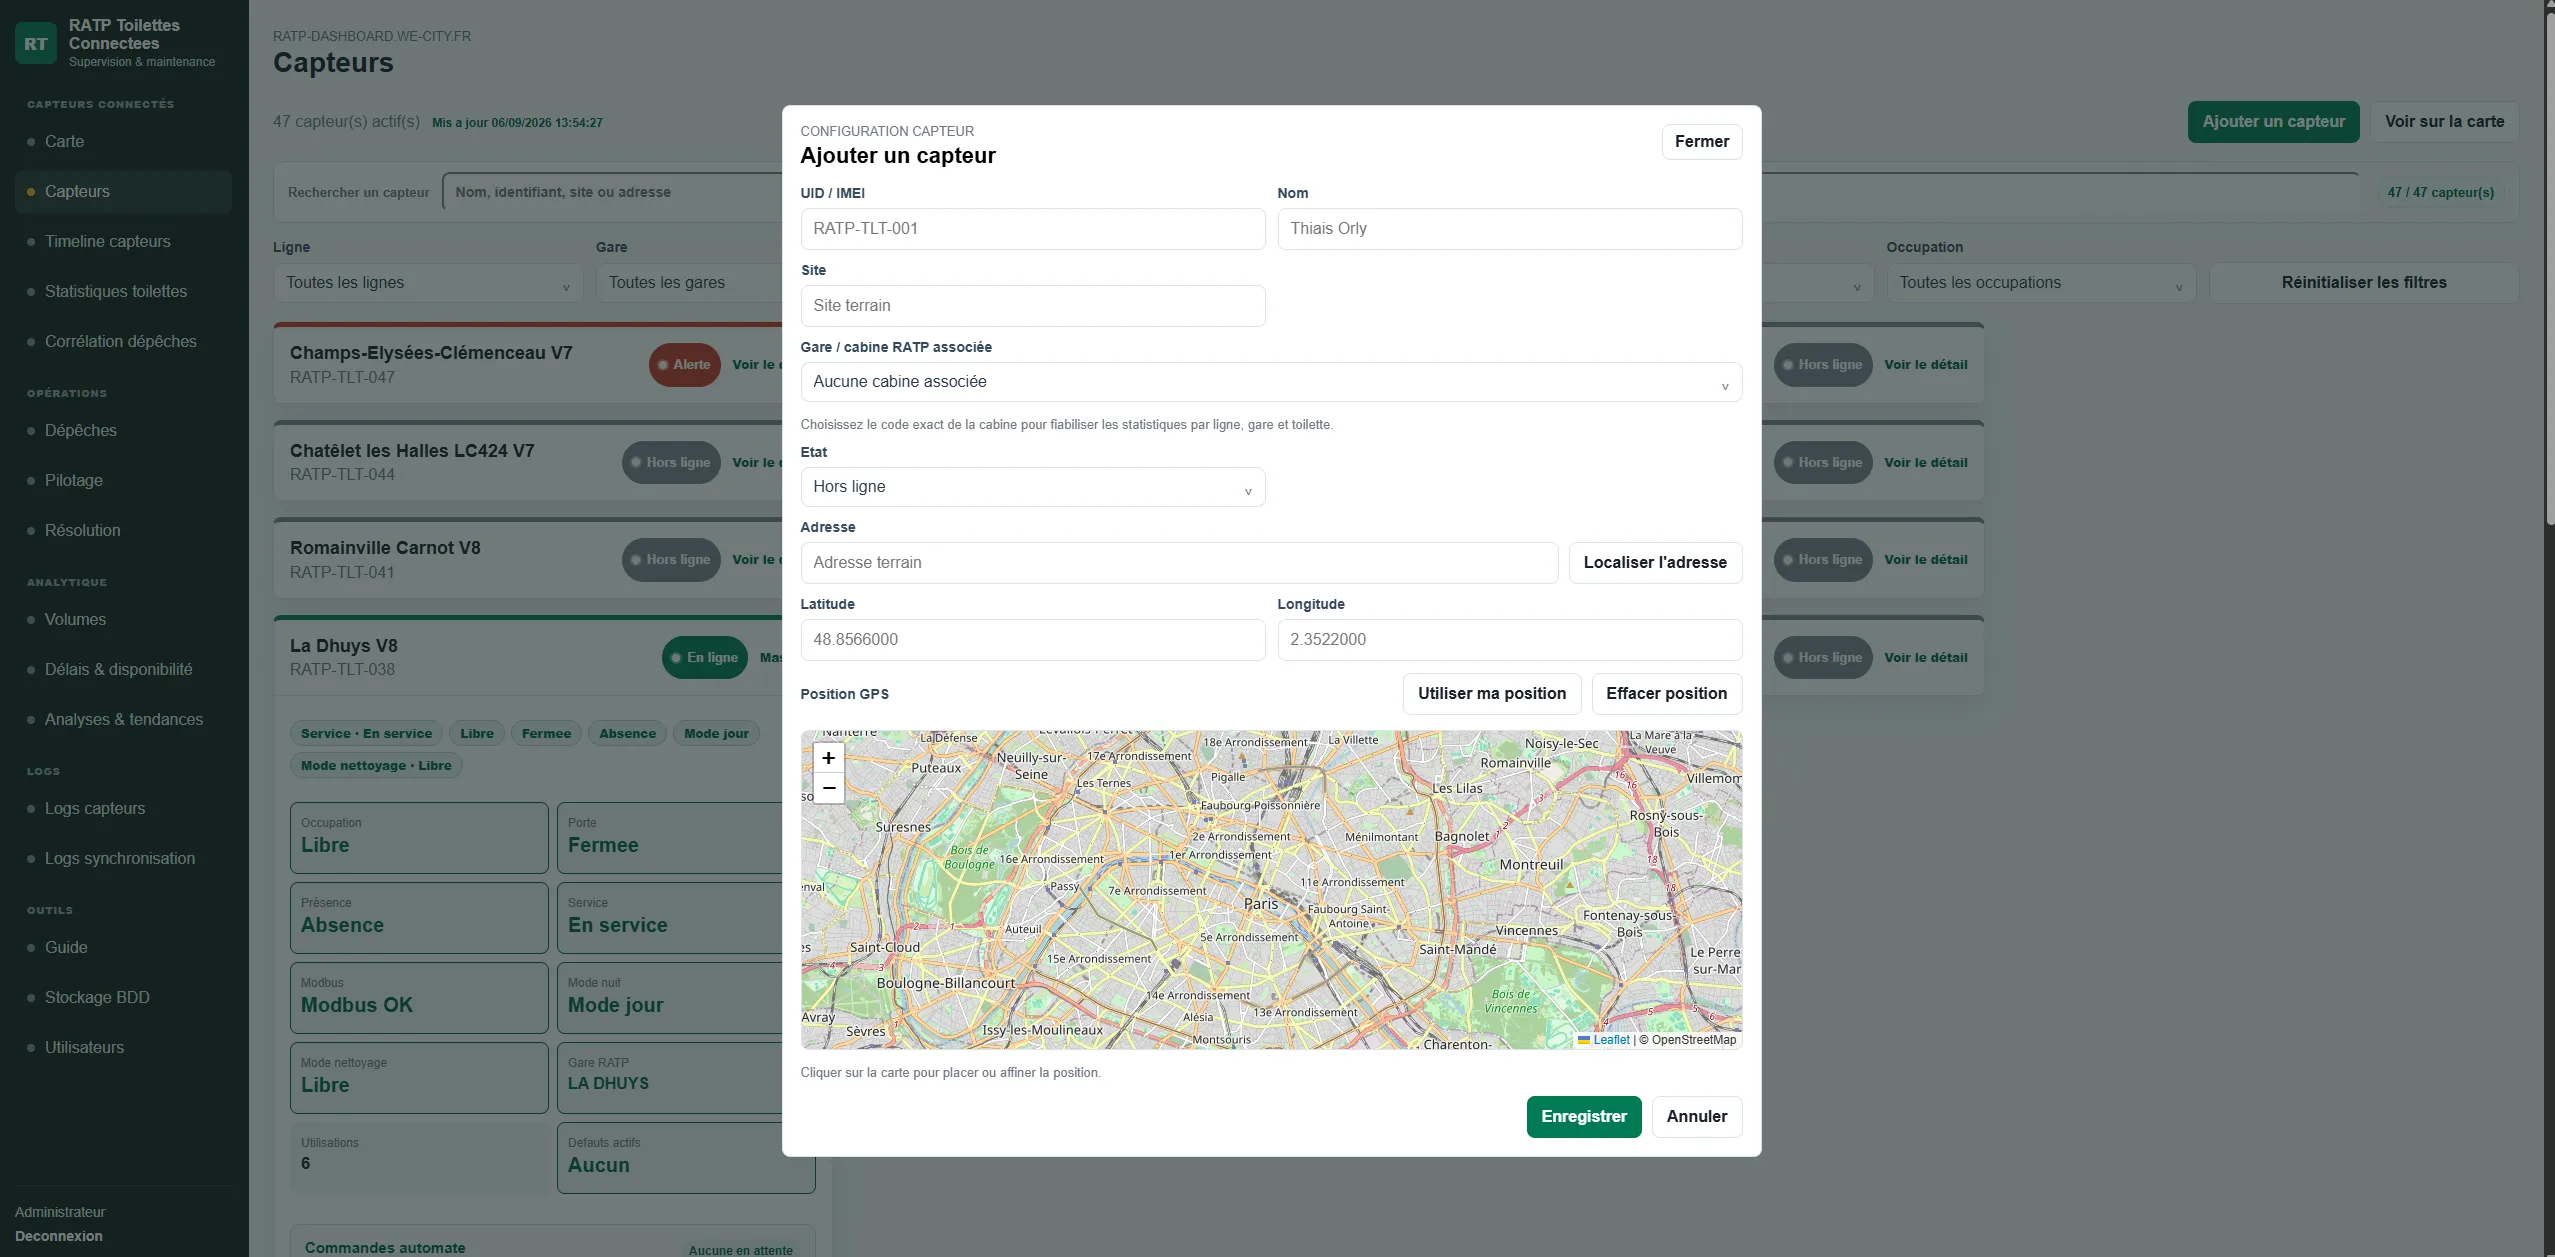
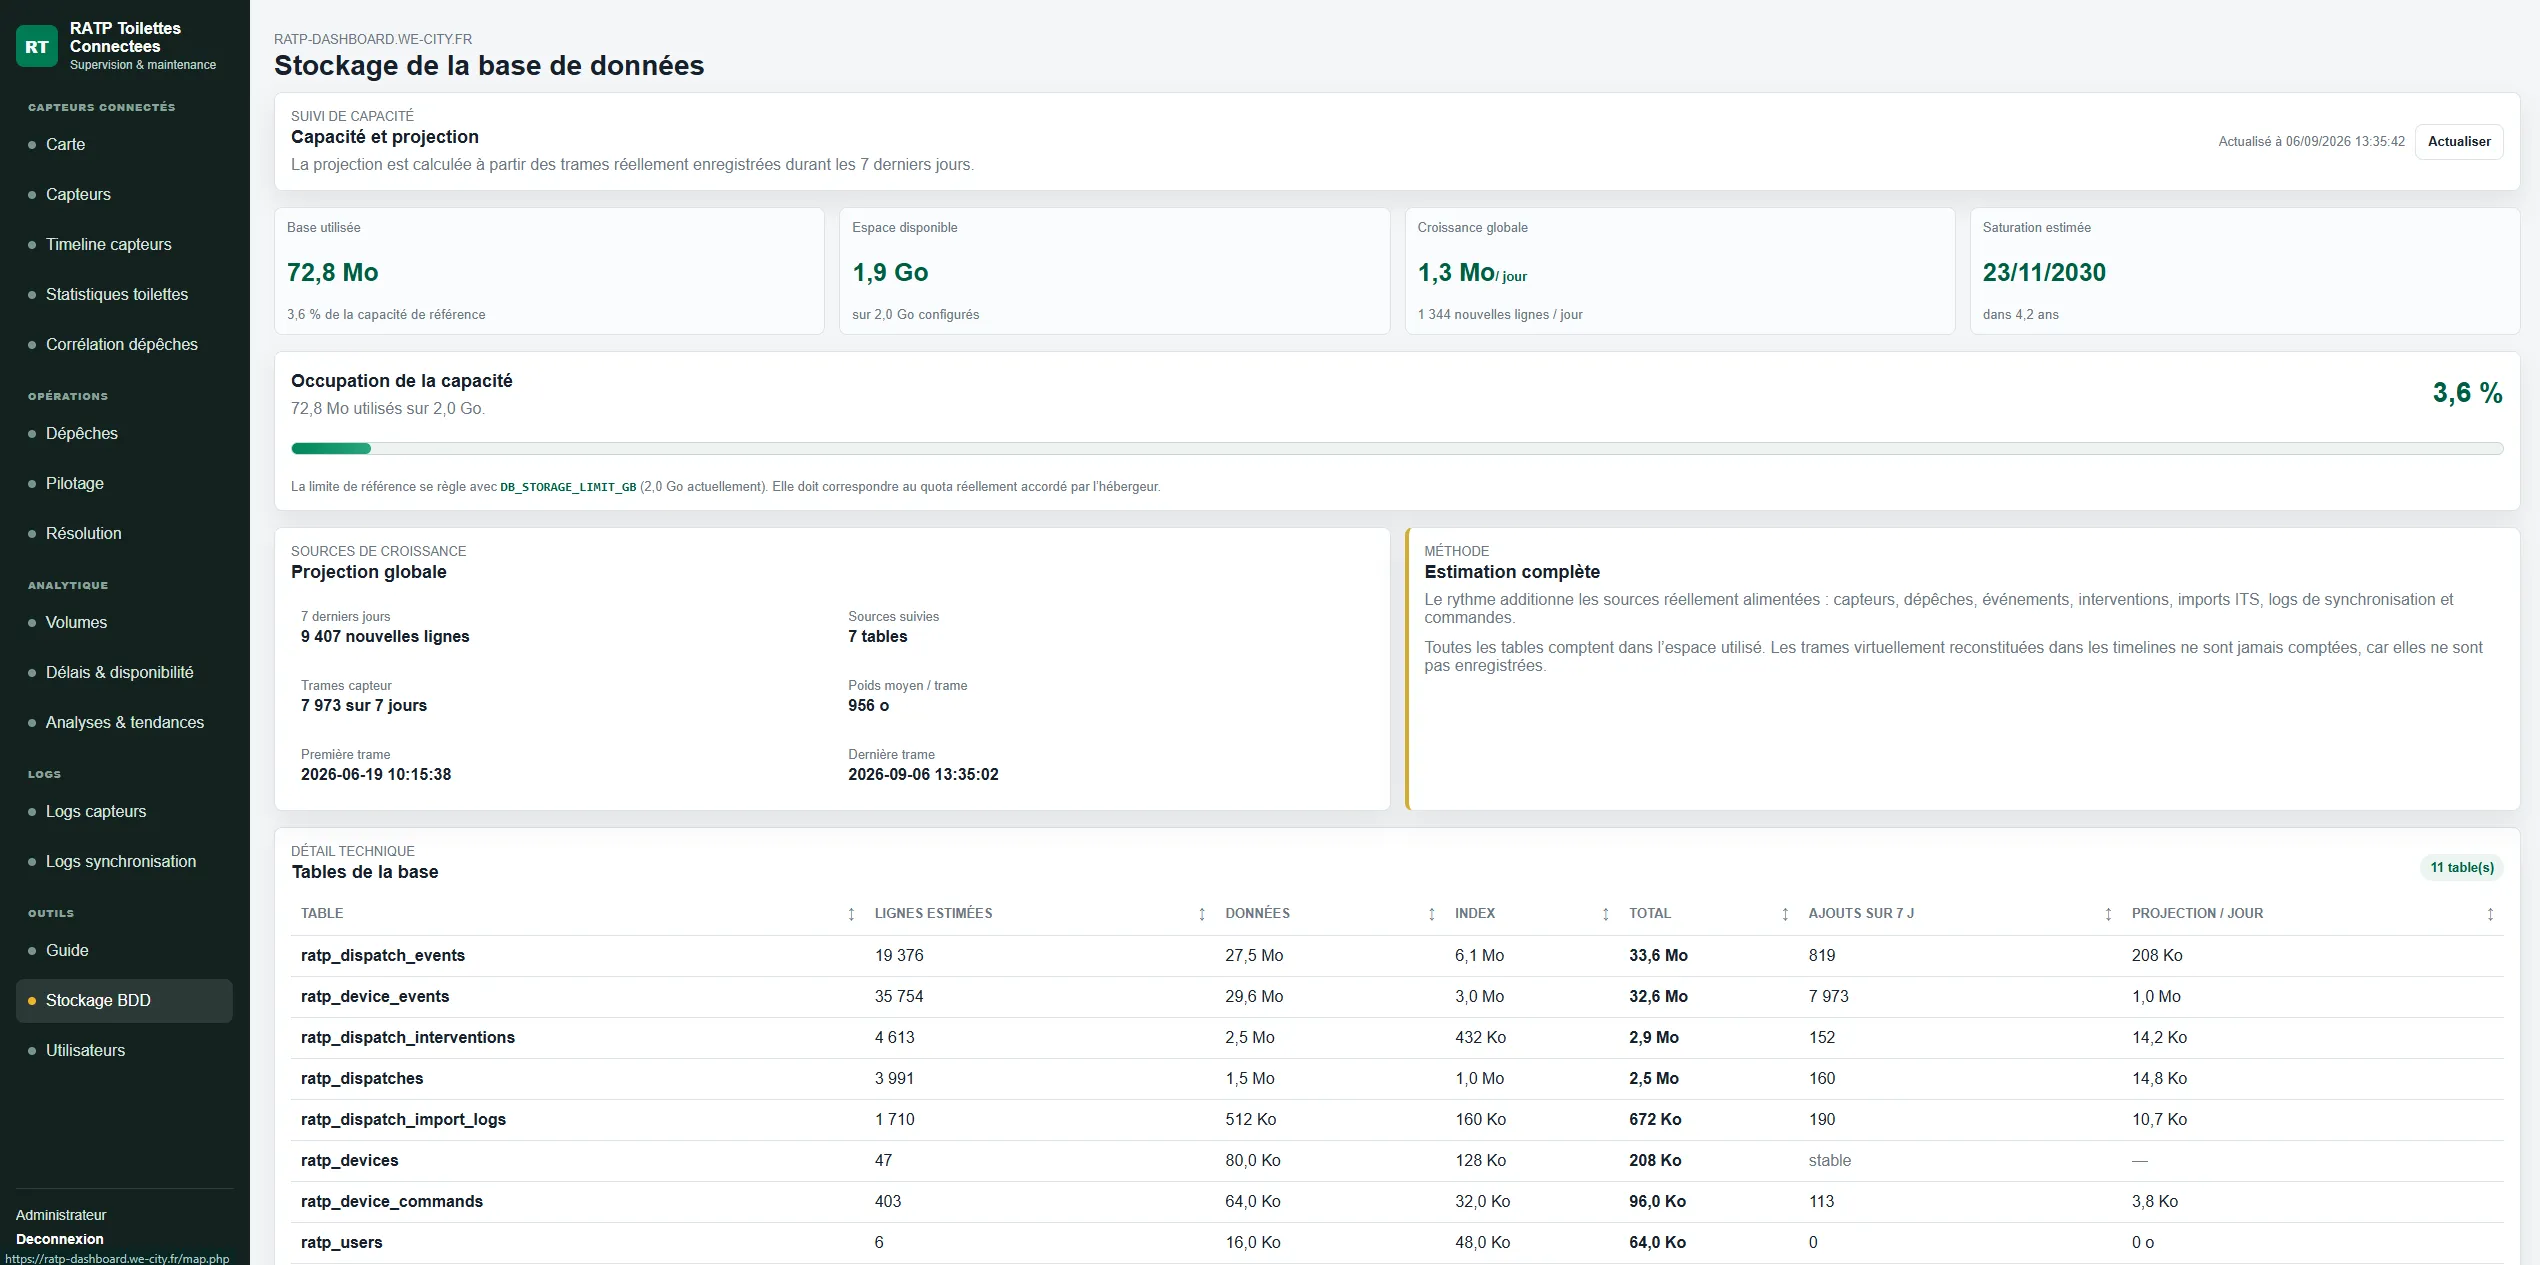
Equipment configuration, dispatch tracking, statistics and administration: explore the application’s other views. Click any screenshot to enlarge it.
 Enlarge screenshot
 Enlarge screenshot
 Enlarge screenshot
 Enlarge screenshot
 Enlarge screenshot
 Enlarge screenshot
 Enlarge screenshot
 Enlarge screenshot
 Enlarge screenshot
 Enlarge screenshot
The team starts with the fleet overview, isolates a device or incident, reviews its history and compares it with operational events. It can then track resolution and explore how the service evolves over time.
Understand the current state of the fleet.
Recover the history and context of an incident.
Track actions, handling times and changes in service.

Business software and products
A business ERP connecting job management, constraint-based scheduling, inventory, invoicing and a customer portal, with ITS Report for video inspection.
Explore the project : Idea to Software
Professional websites
An industrial website with a custom CMS: technical content, the C.A.R.E. method, project references, franchise information and diagnostic enquiries.
Explore the project : RésilinerWhat are you working on?
Sensors, APIs, files, business databases or existing systems: I build applications that bring these sources into an interface designed around your team and its operational decisions. Based in France, I work with European and international teams.
Enter at least 2 characters to start searching.